How an AI does first-level incident analysis
The first fifteen minutes of every production alert are the same seven steps against the same four systems — and the one step that matters most, "have we seen this before?", is the one a human always loses. How a Slack bot runs that pass in under a minute, and how it and the on-call engineer work the incident together.
03:14. #prod-alerts lights up: OOMKilled — checkout-api, 3 restarts in 10 minutes.
Somebody is about to spend fifteen minutes finding out why. Somebody already did, three weeks ago — it's in a Slack thread that has long since scrolled away.
This post is about closing that gap: what the first pass actually consists of, how a bot runs it, and how the bot and the on-call engineer work the incident together afterwards. The build is a three-part series: the agent (LangGraph, LangChain, MCP), recall (embedding and vector search), and memory (persistence and context engineering).
The problem
Two problems wearing one coat.
The investigation is repetitive. Every alert of a given shape gets the same queries against the same systems, in roughly the same order, by whoever happens to be on call. It is skilled work in the sense that you have to know how to do it, and unskilled in the sense that knowing it changes nothing about how long it takes.
The knowledge is disposable. The conclusion lands in a thread. The thread scrolls. Six weeks later the same alert fires, a different engineer starts from zero and reaches the same conclusion by the same route. Nobody wrote a runbook, because writing a runbook for every incident is a job nobody has.
The second one is what actually costs you. The first is just slow.
How an engineer does the first pass
Watch what happens between the alert firing and someone forming an opinion. It is not mysterious — it is seven steps, and the same seven steps nearly every time.
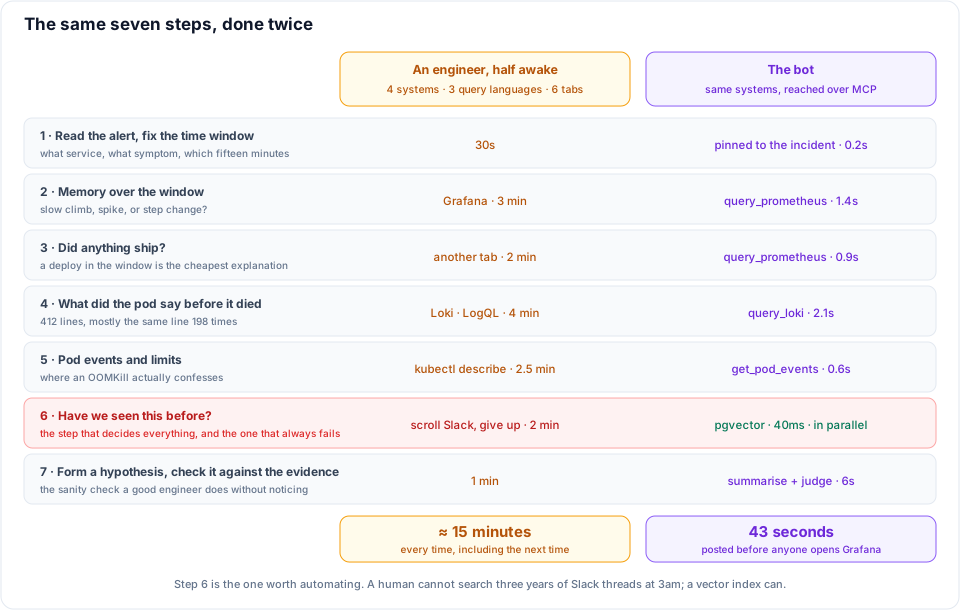
Read the left column first. Nothing there is hard. What makes it cost fifteen minutes is that it spans four systems and three query languages, and you are switching between them at 3am from memory, while the service is down.
Then look at step 6, because it is the one that matters. Have we seen this before? is the question whose answer would collapse the other six steps into thirty seconds — and it is the question a human cannot answer. Slack search is keyword search over a channel with tens of thousands of messages, and the thread you want used different words than the ones you are typing. So in practice everyone skips it, investigates from scratch, and re-derives a conclusion that already existed.
That is the honest shape of first-level analysis: six steps that are merely slow, and one step that is effectively impossible by hand.
How the AI automates it
The bot does the same seven steps. What changes is who holds the query languages, what runs in parallel, and whether step 6 works at all.
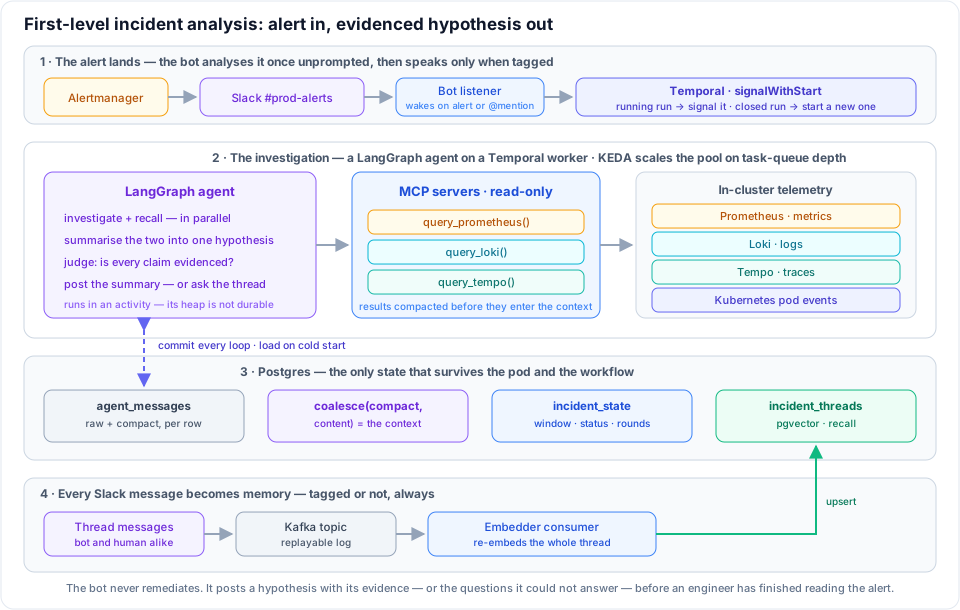
The tools are already governed. The bot doesn't get credentials to Prometheus, Loki and Tempo. It calls MCP servers already running in the cluster — read-only by construction, bounded time ranges, capped result sizes, every call audited. It is a new client of an existing door, which is a far easier thing to get approved than a new door.
The sequence is a graph, not a free-running agent. Hand a model the tools and let it improvise until it feels finished and you get an unbounded token bill, behaviour that differs run to run, and no step you can test in isolation. The shape of a first-level pass is known in advance, so it is encoded rather than rediscovered on every alert.
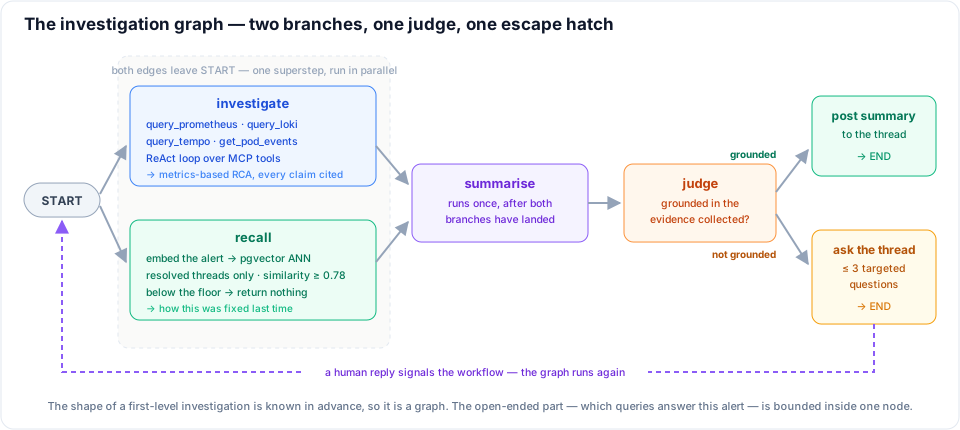
Steps 2–5 become one branch. Step 6 becomes a second branch that runs at the same time instead of being skipped. The genuinely open-ended part — which queries answer this particular OOMKill — is still a free-running loop over the tools, but it is one node inside a bounded graph rather than the whole architecture. Let the model be creative where creativity is the job; constrain the rest structurally.
Step 6 works now, because there is a corpus. Every message in the alert channel is embedded, so "have we seen this before" is a vector search over resolved incidents rather than a keyword search over chat. It matches on the shape of the failure rather than the words someone happened to type — which is how it finds the August thread that said "container killed" when today's alert says "OOMKilled".
Step 7 is made explicit. The sanity check a good engineer performs without noticing — does the evidence I gathered actually support what I am about to say? — becomes a separate grading pass: an LLM-as-judge with the rubric narrowed to one question. Is every claim supported by evidence collected during this investigation? Grading groundedness is far more reliable than grading whether a root cause is correct, and it catches the failure that matters — the confident invented cause.
Forty-three seconds, and the thread opens with a hypothesis that has its evidence attached.
How the human and the AI work it together
This is the part that decides whether anyone keeps it switched on.
An incident thread has several engineers in it at once, thinking out loud and disagreeing. A bot that answers every message is a participant nobody invited. So it speaks exactly twice.
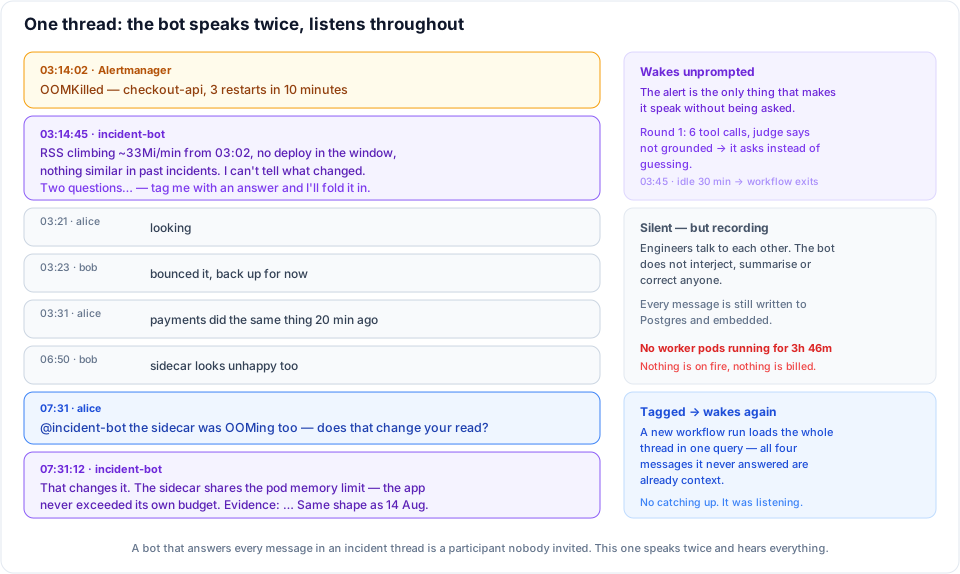
It goes first, then gets out of the way. The alert is the only thing that makes it speak unprompted. After that it is silent until tagged.
When it can't ground a claim, it asks instead of guessing. If the judge rejects the summary, the bot doesn't stay quiet and doesn't post anyway. It posts what it does know, and the specific question it cannot answer from telemetry:
I can see
checkout-apiOOMKilled 3× since 03:02, RSS climbing ~33Mi/min from a flat baseline, no matching deploy in the window and nothing similar in past incidents. I can't tell what changed. Two questions: did anything ship to a dependency ofcheckout-apiaround 03:00, and is the payload cache config still bounded? Tag me with an answer and I'll fold it in.
That is a better contribution than a wrong root cause on every axis. It shows its evidence, it is honest about the gap, and it asks something a human can answer in one line. The bot not knowing something is how the collaboration starts.
It is listening the whole time it isn't speaking. Every message in the thread is recorded whether the bot was addressed or not — so when someone tags it four hours later, the forty messages in between are already context. No catching up, no "here's what you missed", no re-pasting a graph. It answers against the whole conversation.
One rough edge is worth naming: the natural reply to the bot's question is a plain answer with no tag, which will not wake it. So it asks to be tagged, explicitly, in the message where it asks.
And the collaboration becomes the dataset. This is the loop that makes the whole thing compound.
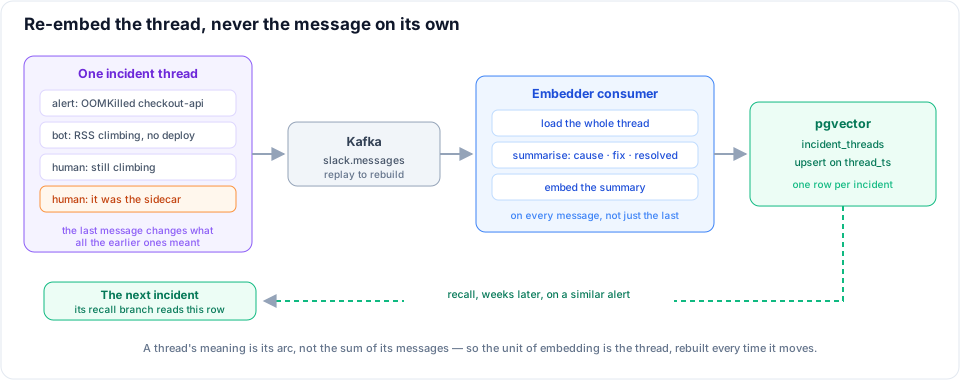
The argument the engineers had at 03:31, the thing bob noticed about the sidecar at 06:50, the answer alice gave at 07:31 — all of it is the record of how this incident was actually solved, and all of it is what step 6 searches next time. The unit is the thread, never the individual message: "still climbing" is a vector pointing nowhere, and the final "it was the sidecar, not the app" retroactively changes what the previous twenty messages meant.
Which means the fifteen minutes an engineer spends today is the last time anyone spends it on that failure. Not because someone wrote a runbook — because they had a conversation, and the conversation was kept.
What it's worth, honestly
The first fifteen minutes are now spent reading rather than querying. On alerts with a historical match the thread opens with the previous root cause and the fix, and the engineer's job starts at "is this the same thing again?" instead of "what is this?". On genuinely novel alerts the bot mostly asks a good question, which is a modest but real win at 3am.
The limits, just as plainly:
- The judge is itself a model. It needs calibrating against human labels before it gates anything — a judge nobody has checked is a rubber stamp with extra latency.
- The corpus is only as good as the threads. An incident resolved in a DM, or over a call, teaches it nothing.
- Compaction can be quietly wrong. Four hundred log lines become thirty; the raw is kept precisely so you can audit whether a digest ever dropped the line that turned out to be the cause.
- There is a token bill per alert. Small next to an engineer's time, but it scales with your noisiest alerts — one more reason to fix those.
- It stays first level, permanently. It does not restart pods, edit limits, page anyone or close the incident. The moment it starts proposing remediation, every property that makes it safe to run unattended is gone.
None of the pieces are novel. What makes it work is refusing to let the agent be the architecture: the model investigates and writes, the graph decides what runs, the judge decides what ships, and the database — not the process — decides what is remembered. The bot is allowed to be wrong. It just isn't allowed to be wrong confidently, in public, with no evidence attached.
How all of it is built, in three parts: the bounded agent — MCP, the LangGraph state graph and the judge; embedding and vector search — making step 6 possible at all; and memory and context engineering — the table behind the thread above, walked row by row.
Related posts
Agent memory and context engineering in Postgres (3/3)
An agent whose pod can vanish mid-investigation and whose workflow exits after thirty minutes idle — so every message it has ever seen is a row, in one table with a raw column and a compacted one, with tool output reduced before it reaches the context. Plus one incident thread walked row by row, from 42,709 tokens of telemetry down to 1,889.
Beyond 200 OK: connecting LLM traces to business outcomes with OpenTelemetry
The application-level semantic layer of LLM observability: representing user intent, answer quality and business outcomes as telemetry on the trace, and correlating spans with eval results and feedback to see whether the AI served the user.
Analysing incidents in plain language with MCP and AI
Investigating incidents by asking questions in plain language — exposing Prometheus, Loki and Tempo as tools an AI assistant calls over the Model Context Protocol, instead of reaching for PromQL, LogQL and TraceQL.