Agent memory and context engineering in Postgres (3/3)
An agent whose pod can vanish mid-investigation and whose workflow exits after thirty minutes idle — so every message it has ever seen is a row, in one table with a raw column and a compacted one, with tool output reduced before it reaches the context. Plus one incident thread walked row by row, from 42,709 tokens of telemetry down to 1,889.
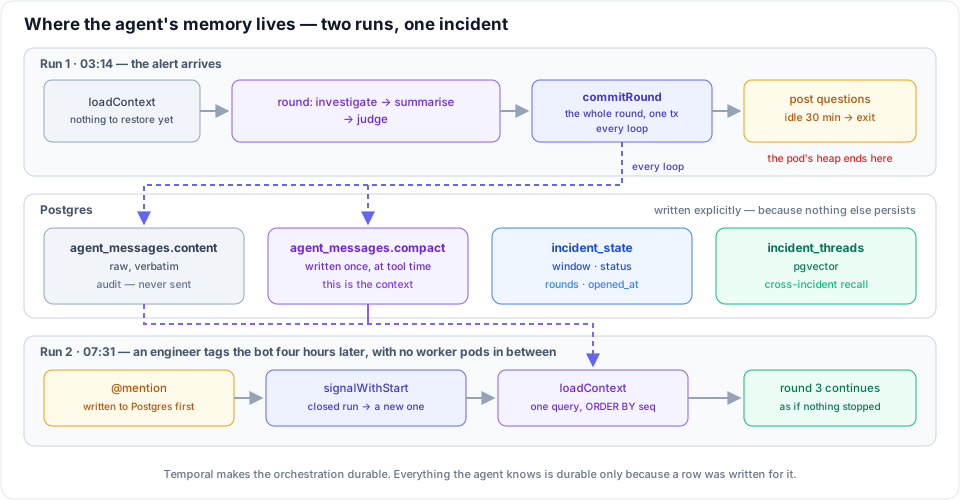
The design post makes a claim that sounds like an implementation detail and is not: the bot is listening the whole time it is not speaking, so a mention four hours later needs no catching up.
This post is what makes that true, and what it costs. It is the last of three build posts.
- Part 1/3 — the agent: MCP, LangGraph, the judge, and scaling the workers.
- Part 2/3 — embedding and vector search: how step 6 works at all.
- Part 3/3 — memory and context (this post).
Nothing the agent holds survives
Part 1 established that the agent cannot run in workflow code — model calls are nondeterministic and do network I/O, and workflow functions must be replayable. So the agent runs in an activity: an ordinary function on an ordinary pod with an ordinary heap.

Temporal records activity results, not activity state. When a worker dies mid-activity, nothing about its local variables was captured. The workflow survives — replayed elsewhere from history — but the activity restarts from line one. Five model calls and six tool calls before it died? All eleven happen again unless you made them idempotent yourself. That is the entire reason the tool cache and the deterministic message ids below exist.
That is the entire reason the tool cache and the deterministic message ids below exist — and the reason the workflow can exit after thirty minutes idle, as part 1 describes, without losing the investigation. Everything from here is the machinery that makes exiting survivable.
Context engineering: what is allowed in the window
Reduction happens at the tool boundary, so the fat version never enters the conversation once. Deterministic work goes first — the filter call would otherwise have to read all 400 lines itself:
async function compactLoki(raw: LogLine[], alert: Alert): Promise<Digest> {
	// 1. deterministic — 400 lines is usually 6 patterns and a lot of repetition
	const candidates = fingerprint(raw); // dedupe, count, first/last seen, keep all error+
	if (tokens(candidates) < BUDGET) return render(candidates);

	// 2. the model selects, it does not write — ids only, so it cannot invent a log line
	const {keep} = await selector // small fast model, temperature 0
		.withStructuredOutput(z.object({keep: z.array(z.number()), reason: z.string()}))
		.invoke([{role: 'user', content: renderCandidates(candidates, alert)}]);

	// 3. reconstruct verbatim from the candidates, re-attaching the counts
	return render(keep.map((i) => candidates[i]));
}
Three things there are load-bearing. Dedupe before you filter — 198 copies of JS heap out of memory are one signal, so the model reads forty candidates instead of four hundred, and the counts survive because ×198 in 76 seconds is itself diagnostic. Return ids, not text — a filter that emits log lines can invent one, and that fabricated line becomes evidence the judge grades against; selection is checkable, generation isn't. Keep the raw — the digest is a view of the result, never a replacement for it; both are stored, and the storage section shows where.
Each tool gets its own compactor, and the call path enforces the budget rather than trusting one:
type Compactor = (raw: unknown, alert: Alert) => Promise<Digest>;

const COMPACTORS: Record<string, Compactor> = {
	query_loki: compactLoki, // patterns + counts + first/last + exemplars
	query_prometheus: compactSeries, // trend shape + min/max/last, downsampled
	query_tempo: compactTrace, // critical path and error spans, not the tree
	get_pod_events: compactEvents, // dedupe by reason, keep the counts
};

async function callTool(threadTs: string, tool: string, args: ToolArgs) {
	const hit = await cachedDigest(threadTs, tool, args);
	if (hit) return hit; // a Temporal retry costs neither the query nor the compaction

	const raw = await mcp.call(tool, args);
	const digest = await (COMPACTORS[tool] ?? passthrough)(raw, alert);

	if (tokens(digest) > BUDGET) throw new Error(`${tool} compactor blew the budget`);
	return {raw, digest};
}
The cache is keyed by tool and arguments, so the filter runs once per distinct call and a retry reads back identical bytes — which keeps the deterministic message ids below actually deterministic.
The rule for every compactor: remove repetition and resolution, never facts. Every number, timestamp and count a claim might cite has to survive, because the judge grades against exactly this. A compactor that drops "512Mi at 03:14" gets a correct summary rejected.
One table, two renderings of every message
The tempting split is a raw log plus a separate bounded summary that re-enters the context. I built that first and it was wrong: loading it read the summary and everything written since, so it paid both costs and added reconciliation — and two stores that can disagree need a watermark, which is a race the second store invents.
One table, two columns per row:
CREATE TABLE agent_messages (
  id           text   PRIMARY KEY,       -- deterministic: thread:round:node:i
  thread_ts    text   NOT NULL,
  seq          bigint NOT NULL DEFAULT nextval('agent_msg_seq'),
  round        int,                      -- null while the bot is silent
  role         text   NOT NULL,          -- human | ai | tool
  tool_call_id text,                     -- on tool rows: pairs back to an ai row
  content      jsonb  NOT NULL,          -- raw, verbatim, never sent to the model
  compact      jsonb,                    -- what the model sees; null = send content
  tokens       int    NOT NULL,          -- of coalesce(compact, content)
  created_at   timestamptz DEFAULT now()
);
CREATE INDEX ON agent_messages (thread_ts, seq);
content is the audit trail and the re-compaction source; compact is the context. The distinction is per column, not per table — the same row is what the model reads and what you grep in a review. A small companion row holds what has no home on a message: the pinned window, the status, the round count. The system preamble is deliberately not stored, because it changes every load.
Commit the round atomically
Temporal activities are at-least-once. Six messages appended, seventh model call fails, activity retries — and you get those six rows again. Hence deterministic ids:
export async function commitRound(threadTs: string, result: RoundResult) {
	return db.tx(async (t) => {
		for (const [i, m] of result.newMessages.entries()) {
			await t.query(
				`INSERT INTO agent_messages
				   (id, thread_ts, round, role, tool_call_id, content, compact, tokens)
				 VALUES ($1, $2, $3, $4, $5, $6, $7, $8) ON CONFLICT (id) DO NOTHING`,
				[
					`${threadTs}:${result.round}:${m.node}:${i}`, // reproducible across retries
					threadTs,
					result.round,
					m.role,
					m.toolCallId,
					m.raw,
					m.digest ?? null,
					m.tokens,
				],
			);
		}
		return advanceState(t, threadTs, result); // rounds, status
	});
}
One transaction per round, not per message, for a reason unrelated to efficiency: an assistant message carrying tool_calls and the tool rows answering them must never be separated. Split them and every subsequent load fails at the provider with a hard 400 — not a worse answer, an error, forever.
Loading is one query
export async function loadContext(threadTs: string): Promise<Context> {
	const {rows} = await db.query(
		`SELECT role, tool_call_id, coalesce(compact, content) AS content, tokens
		   FROM agent_messages
		  WHERE thread_ts = $1
		  ORDER BY seq`,
		[threadTs],
	);

	return {
		...(await fetchState(threadTs)), // window, status, rounds
		messages: repairDanglingToolCalls(rows.map(toLangChainMessage)),
	};
}
That's the whole mechanism. No summarisation at read time, no model call, no array-wide pass — because nothing is ever compacted at load. Each object was compacted once when created and written already-small. The rows aren't raw material waiting to be reduced; they are the reduced form.
The repair pass catches whatever a torn earlier write left behind:
function repairDanglingToolCalls(messages: BaseMessage[]): BaseMessage[] {
	const answered = new Set(messages.filter((m) => m.getType() === 'tool').map((m) => (m as ToolMessage).tool_call_id));

	// drop any assistant turn whose calls did not all come back
	return messages.filter((m) => {
		if (m.getType() !== 'ai') return true;
		const calls = (m as AIMessage).tool_calls ?? [];
		return calls.length === 0 || calls.every((c) => answered.has(c.id!));
	});
}
Dropping the turn rather than synthesising a fake "tool errored" result is deliberate: an invented result is evidence the judge might later grade a claim against.
When a thread gets long
Five rounds and forty messages is around a hundred rows, which compacted lands in the low thousands of tokens — so for most incidents write-time compaction is the whole story, and the guards make that a ceiling rather than a hope. When a long thread does approach the budget, don't truncate the head; re-render old rows in place:
UPDATE agent_messages SET compact = $2, tokens = $3 WHERE id = $1;
Round one's Loki digest becomes one line once round four is running — lossy in context, lossless in storage, and a per-row UPDATE chosen by a running tokens sum rather than a bulk pass. Policy: current round at full digest, previous round trimmed to headline plus evidence id, older rounds collapsed to a line, and four things never compacted at all — the alert, the pinned window, human turns, and the judge's rejections.
One thread, row by row
This is the thread from the design post — the same alert, the same four engineer messages, the same tag at 07:31 — as it exists in the table. Token counts are illustrative; the ratios are the point.
agent_messages · thread_ts = 1757_1103.4471 · ORDER BY seq

seq rnd role   what it is                            raw tok   in context
─────────────────────────────────────────────────────────────────────────
  1   1 human  alert: OOMKilled checkout-api ×3           45           45
  2   1 ai     tool_call query_prometheus                 25           25
  3   1 tool   container_memory · 4 series × 60 pts    9,200          180
  4   1 ai     tool_call query_loki                       25           25
  5   1 tool   412 log lines                          21,400          260
  6   1 ai     tool_call get_pod_events                   20           20
  7   1 tool   30 events                               3,100           90
  8   1 ai     round-1 hypothesis                        240          240
  9   1 ai     judge: not grounded, 2 questions          130          130
 10   1 ai     posted to thread: the questions            90           90
                                    ── idle 30 min, workflow exits ──
 11   – human  "looking"                                   6            6
 12   – human  "bounced it, back up for now"              14           14
 13   – human  "payments did the same 20 min ago"         18           18
 14   – human  "sidecar looks unhappy too"                12           12
 15   – human  "@incident-bot the sidecar was OOMing      24           24
                too — does that change your read?"
                                  ── mention: new run, round 2 ──
 16   2 ai     tool_call query_prometheus (sidecar)       25           25
 17   2 tool   container_memory · sidecar · 60 pts     7,800          150
 18   2 ai     round-2 hypothesis                        260          260
 19   2 ai     judge: grounded                            95           95
 20   2 ai     posted to thread: the summary             180          180
─────────────────────────────────────────────────────────────────────────
                                                     42,709        1,889
Rows 11–14 are the wake rule made visible: round is null because the bot wasn't running, but the rows exist — recorded, not answered. By the time row 15 tags it, the discussion is already context. That's what "no catching up" means mechanically.
Row 5 is where the compaction earns its keep:
{
	"id": "1757_1103.4471:1:investigate:3",
	"seq": 5,
	"round": 1,
	"role": "tool",
	"tool_call_id": "toolu_01H…",

	"content": {
		// raw — never sent, kept for audit
		"tool": "query_loki",
		"args": {"app": "checkout-api", "start": "03:02:00", "end": "03:17:00"},
		"lines": ["…412 entries…"]
	},

	"compact": {
		// what the model actually sees
		"tool": "query_loki",
		"window": "03:02–03:17",
		"summary": "412 lines, 6 distinct patterns",
		"patterns": [
			{"n": 198, "first": "03:12:44", "last": "03:14:01", "line": "FATAL ERROR: JS heap out of memory"},
			{"n": 3, "first": "03:14:02", "last": "03:14:51", "line": "Container checkout-api was OOMKilled"},
			{"n": 21, "first": "03:02:11", "last": "03:16:58", "line": "payload cache size=48211 evictions=0"}
		],
		"evidence_id": 5,
		"more": "get_evidence(5)"
	},
	"tokens": 260
}
21,400 tokens to 260, with the diagnosis intact: evictions=0 on a cache holding 48k entries is the unbounded cache, still verbatim, with its count and time range. The 198 identical heap errors collapse to one line and a number — and the number is the signal, so it stays.
The companion row, whole:
incident_state · thread_ts = 1757_1103.4471

window_start  03:02:00     service    checkout-api
window_end    03:17:00     status     resolved
rounds        2            opened_at  03:14:02
And the preamble, rendered at load on round 2 and stored nowhere:
Continuing an investigation you began 4h 17m ago.
The alert window is fixed at 03:02–03:17. Do not query outside it.
Established: memory climbs ~33Mi/min from 03:02 (evidence 3).
Rejected last round: "the memory limit is too low" — unsupported.
Open: did anything ship around 03:00? Is the payload cache bounded?
An engineer has just tagged you. Do not repeat tool calls whose
results are already in evidence.
So round 2 reaches the model as ~1,900 tokens of conversation plus a 210-token preamble, standing in for 42,709 tokens of telemetry that never left Postgres — and all 42,709 are still there if the judge, or a human next week, wants to check.
The shape of it
Four rules did most of the work, and they port to any agent that has to survive being interrupted:
- The orchestrator owns the lifecycle, not the state. One run per round; the incident lives in the database.
- Compact at write time, never at read time. The load is a query, and it costs nothing.
- Keep the raw beside the compact. Every reduction is a view, so every reduction is reversible and auditable.
- Gate the voice, not the memory. Record everything; speak rarely.
Why any of it is shaped this way — and an honest account of what the bot is and isn't worth — is in the design post. The agent itself is part 1; the recall corpus is part 2.
Related posts
Embedding and vector search for incident recall (2/3)
Step 6 of a first-level investigation — "have we seen this before?" — is the one a human always loses, because Slack search is keyword search. How pgvector makes it work: rendering alerts and resolved threads into the same shape so similarity means something, a cosine HNSW index and the filter trap hiding inside it, and a Kafka pipeline that re-embeds whole threads rather than messages.
How an AI does first-level incident analysis
The first fifteen minutes of every production alert are the same seven steps against the same four systems — and the one step that matters most, "have we seen this before?", is the one a human always loses. How a Slack bot runs that pass in under a minute, and how it and the on-call engineer work the incident together.
Building a RAG pipeline with pgvector and vLLM
How retrieval-augmented generation grounds an LLM in your own data — chunking, embeddings, vector search with pgvector and generation with a self-hosted vLLM endpoint.