Incident agents with LangGraph, LangChain and MCP (1/3)
How the investigation itself is built and run — MCP servers as the only door to Prometheus, Loki, Tempo and pod events; a LangGraph state graph running the telemetry sweep and the recall search in parallel; a ReAct loop confined to a single node; an LLM judge deciding whether anything gets posted; why none of it can live inside workflow code; and KEDA scaling the workers to zero between incidents.
The design post describes first-level incident analysis as seven steps — read the alert, check memory, check deploys, read logs, read pod events, ask whether we have seen this before, form a hypothesis and check it — and a Slack bot that runs them in 43 seconds instead of fifteen minutes.
This is the first of three build posts, and it covers the investigation itself: the tools, the graph that sequences them, and the judge that decides whether the result is fit to post.
- Part 1/3 — the agent (this post): MCP, LangGraph, the ReAct leaf, the judge, and the workers that run it.
- Part 2/3 — embedding and vector search: how step 6 becomes possible at all.
- Part 3/3 — memory and context engineering: how a thread survives a pod that vanishes.
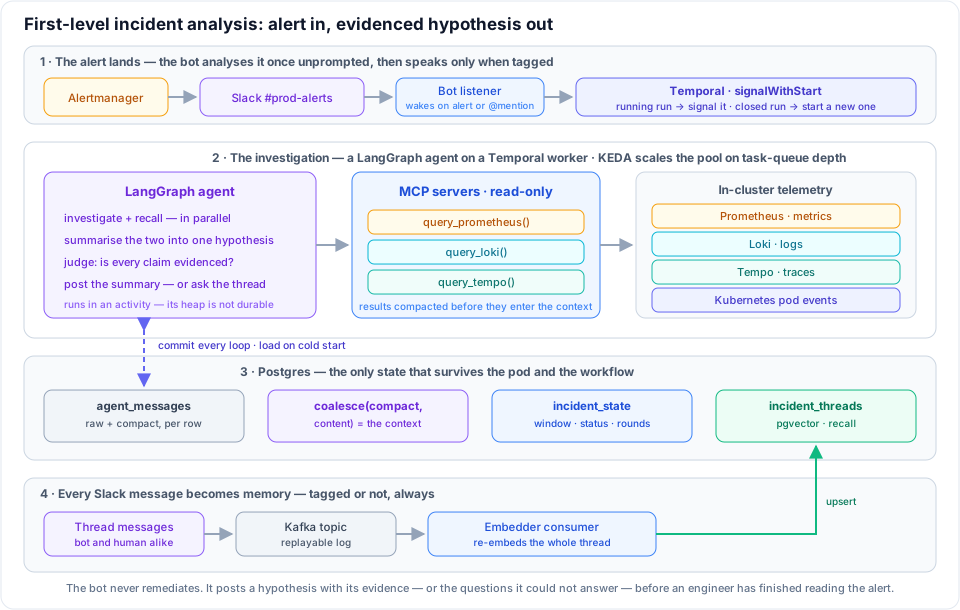
The tools: one governed door
The bot never holds credentials for Prometheus, Loki or Tempo. It gets a client for MCP servers already running in the cluster — read-only by construction, bounded time ranges, capped result sizes, every call audited — so the guardrails are inherited rather than reimplemented.
import {MultiServerMCPClient} from '@langchain/mcp-adapters';
import {ChatAnthropic} from '@langchain/anthropic';
import {createReactAgent} from '@langchain/langgraph/prebuilt';

const mcp = new MultiServerMCPClient({
	mcpServers: {
		observability: {transport: 'http', url: `${MONITORING}/mcp-observability`},
		kubernetes: {transport: 'http', url: `${MONITORING}/mcp-kube`},
	},
});

// query_prometheus · query_loki · query_tempo · get_pod_events · describe_pod
const tools = await mcp.getTools();

const investigator = createReactAgent({
	llm: new ChatAnthropic({model: 'claude-sonnet-5', temperature: 0}),
	tools,
	prompt: INVESTIGATOR_PROMPT, // "cite the tool result behind every claim"
});
That is steps 2 through 5 of the seven: memory, deploys, logs, pod events. Step 6 needs a different kind of tool, and it comes later.
The seven steps, as a graph
Steps 2–5 are one branch. Step 6 is a second branch running at the same time. Step 7 is the judge.
import {Annotation, StateGraph, START, END} from '@langchain/langgraph';

const Incident = Annotation.Root({
	alert: Annotation<Alert>,
	// both branches append; the reducer merges them when they converge
	evidence: Annotation<Evidence[]>({reducer: (a, b) => a.concat(b), default: () => []}),
	metricsRca: Annotation<string>,
	priorIncidents: Annotation<PriorIncident[]>,
	summary: Annotation<string>,
	verdict: Annotation<Verdict>,
});

export const graph = new StateGraph(Incident)
	.addNode('investigate', investigateWithMcp) // steps 2–5
	.addNode('recall', recallSimilarIncidents) // step 6
	.addNode('summarise', summariseFindings)
	.addNode('judge', judgeSummary) // step 7
	.addNode('ask', askTheThread)
	.addEdge(START, 'investigate')
	.addEdge(START, 'recall') // two edges out of START — LangGraph runs them in parallel
	.addEdge('investigate', 'summarise')
	.addEdge('recall', 'summarise') // summarise runs once, after both have landed
	.addEdge('summarise', 'judge')
	.addConditionalEdges('judge', (s) => (s.verdict.grounded ? END : 'ask'))
	.addEdge('ask', END)
	.compile();
Two edges out of START is the whole parallelism story: both branches run in the same superstep, and summarise only fires once both have written to state.
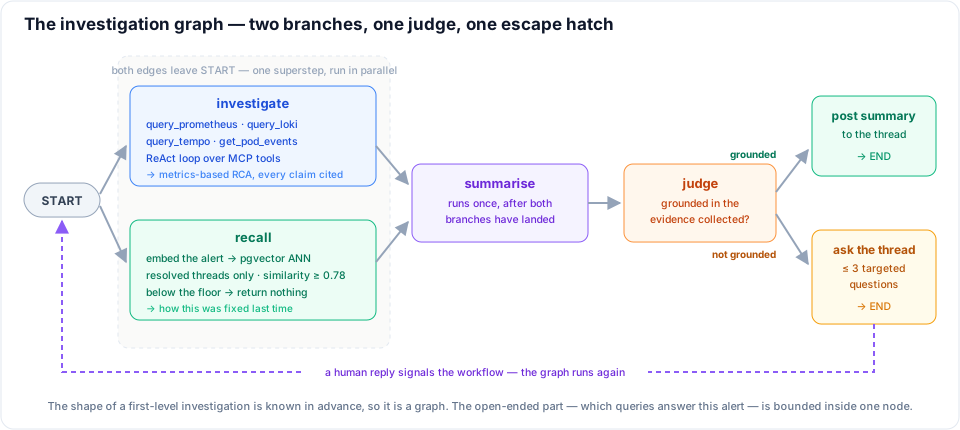
investigate wraps those tools in a ReAct loop, which is the right primitive at the leaf — which queries answer an OOMKill is genuinely open-ended, and the node is bounded by the graph around it rather than by hope.
And step 7, whose verdict decides whether the round posts a summary or a question:
const Verdict = z.object({
	grounded: z.boolean(),
	unsupportedClaims: z.array(z.string()),
	// what a human could tell us that the telemetry can't
	questions: z.array(z.string()).max(3),
	reason: z.string(),
});

const verdict = await judge
	.withStructuredOutput(Verdict)
	.invoke([
		{role: 'system', content: JUDGE_RUBRIC},
		{role: 'user', content: renderForJudging(state.summary, state.evidence)},
	]);
Where the graph actually runs
Workflow code must be deterministic, because Temporal recovers a workflow by replaying it — re-executing the function from the top and feeding recorded results back in place of each activity call. Anything that answers differently on the second pass breaks that: Math.random(), a bare fetch, reading a file. The TypeScript SDK patches what it can (Date.now() and timers are deterministic inside a workflow) and forbids the rest.
A model call is nondeterministic by construction and does network I/O to get there. So the entire agent lives in an activity — which has a consequence worth stating precisely, because "durable execution" suggests otherwise.
It's also why the activity heartbeats:
import {heartbeat} from '@temporalio/activity';

export async function runGraph(ctx: Context, mentions: Mention[]) {
	let last: GraphState | undefined;

	// one beat per superstep — this is what makes heartbeatTimeout mean anything
	for await (const step of await graph.stream(seed(ctx, mentions), {
		configurable: {thread_id: ctx.threadTs},
	})) {
		heartbeat({node: Object.keys(step)[0]});
		last = Object.values(step)[0] as GraphState;
	}

	return toRoundResult(last!);
}
Without beats, a pod that dies ten seconds into a five-minute activity goes unnoticed until startToCloseTimeout expires. With beats and a 30-second heartbeatTimeout, Temporal reschedules within seconds. The trap is setting the timeout without emitting beats: then every investigation longer than thirty seconds fails.
What wakes it
The bot speaks on the alert and on an @mention, and records everything else. The Slack thread timestamp is the workflow ID, which collapses dedupe, routing and "is one already running" into a single call:
import {WorkflowIdReusePolicy} from '@temporalio/common';
import {incidentRound, mention} from './workflows';

app.event('message', async ({event}) => {
	const threadTs = event.thread_ts ?? event.ts; // the alert's message opens the thread

	// always — the record and the embedding pipeline don't wait to be invited
	await appendMessage(threadTs, event);
	await publishToKafka(threadTs, event);

	// engineers talking to each other are recorded, not answered
	if (!isAlert(event) && !mentionsBot(event)) return;

	await client.workflow.signalWithStart(incidentRound, {
		workflowId: `incident-${threadTs}`,
		taskQueue: 'incident-analysis',
		args: [{threadTs}],
		signal: mention,
		signalArgs: [{user: event.user, text: event.text}],

		// the previous run already exited → allow a fresh one under the same id
		workflowIdReusePolicy: WorkflowIdReusePolicy.ALLOW_DUPLICATE,
	});
});
Two different rules are at work, and conflating them is the usual mistake. The running case is what signalWithStart is for by definition — a workflow exists under that ID, so the call signals it rather than starting a second investigation. The closed case is governed by the reuse policy: ALLOW_DUPLICATE is what permits a brand-new run under an ID already used. One call covers both the mention ninety seconds later and the one at lunchtime tomorrow.
Only the bot's voice is gated. The append and the Kafka publish happen before the mention check, for every message.
Writing to Postgres before signalling closes a race that will otherwise bite at 4am: the idle timer fires and the workflow starts committing its completion at the instant a mention arrives, so the signal lands on an execution already closing and is never handled. With the database as source of truth the signal is only a wake-up — whichever run picks it up reads the conversation from Postgres regardless.
The workflow owns one round, not the incident
A completed Temporal workflow cannot be signalled. Once an investigation goes idle and exits, a mention four hours later starts a new run that rebuilds context from Postgres. So the workflow stays short — loadContext and commitRound are the two activities that make that possible, and both are below:
import {proxyActivities, defineSignal, setHandler, condition} from '@temporalio/workflow';
import type * as activities from './activities';

export const mention = defineSignal<[Mention]>('mention');

const {loadContext, runGraph, commitRound, postToThread} = proxyActivities<typeof activities>({
	startToCloseTimeout: '5 minutes',
	heartbeatTimeout: '30 seconds', // the graph heartbeats between nodes
	retry: {maximumAttempts: 3}, // Prometheus and Loki are occasionally unwell
});

export async function incidentRound({threadTs}: Trigger): Promise<void> {
	const mentions: Mention[] = [];
	setHandler(mention, (m) => void mentions.push(m));

	// a cold start four hours later begins right here, with everything we knew
	let ctx = await loadContext(threadTs);
	if (ctx.status === 'resolved' || ctx.rounds >= 5 || ctx.ageHours > 24) return;

	while (ctx.rounds < 5) {
		const result = await runGraph(ctx, mentions);
		ctx = await commitRound(threadTs, result); // the whole round, one transaction
		await postToThread(threadTs, result.grounded ? result.summary : result.questions);
		if (result.grounded) return;

		const seen = mentions.length;
		// waits for a tag, not for chatter — and costs nothing while it waits
		if (!(await condition(() => mentions.length > seen, '30 minutes'))) return;
	}
}
The guard stops a comment on a six-month-old thread spinning up a fresh investigation. And there's no separate resume path: a warm mention is condition() returning true, a cold one is loadContext on a new run, and the loop body can't tell the difference.
Scaling the workers
apiVersion: keda.sh/v1alpha1
kind: ScaledObject
metadata:
  name: incident-analysis-worker
spec:
  scaleTargetRef:
    name: incident-analysis-worker
  minReplicaCount: 0 # quiet channel, no workers
  maxReplicaCount: 20
  cooldownPeriod: 300
  triggers:
    - type: temporal
      metadata:
        endpoint: temporal-frontend.temporal.svc.cluster.local:7233
        namespace: production
        taskQueue: incident-analysis
        targetQueueSize: '2'
Scaling to zero is the part that would be reckless almost anywhere else. It is safe here for a reason that is not Temporal's doing: a disappearing pod takes the agent's heap with it, and the only thing that makes that survivable is that the conversation was already written to Postgres — part 3. The cost of losing a pod is bounded by the last committed round: the retry replays from there, cached tool digests serve every call already made, and the bill is one model call rather than an investigation.
The other half follows directly from the loop above. A workflow parked on condition() waiting for a mention puts nothing on the task queue while it waits, so the pool genuinely drops to zero at 04:00 — and the 04:20 mention enqueues a task, wakes KEDA and is picked up seconds later, into a fresh run. This is also where heartbeatTimeout earns itself: KEDA removing a pod mid-investigation is a routine event here, not an incident.
Which raises the obvious question about a workflow that exits: where did loadContext get four hours of conversation from? Every message the agent has ever seen is a row, and that — with the context engineering that keeps those rows small — is part 3.
Next: step 6, the one a human loses — embedding and vector search over past incidents.
Related posts
Analysing incidents in plain language with MCP and AI
Investigating incidents by asking questions in plain language — exposing Prometheus, Loki and Tempo as tools an AI assistant calls over the Model Context Protocol, instead of reaching for PromQL, LogQL and TraceQL.
Agent memory and context engineering in Postgres (3/3)
An agent whose pod can vanish mid-investigation and whose workflow exits after thirty minutes idle — so every message it has ever seen is a row, in one table with a raw column and a compacted one, with tool output reduced before it reaches the context. Plus one incident thread walked row by row, from 42,709 tokens of telemetry down to 1,889.
How an AI does first-level incident analysis
The first fifteen minutes of every production alert are the same seven steps against the same four systems — and the one step that matters most, "have we seen this before?", is the one a human always loses. How a Slack bot runs that pass in under a minute, and how it and the on-call engineer work the incident together.