Analysing incidents in plain language with MCP and AI
Investigating incidents by asking questions in plain language — exposing Prometheus, Loki and Tempo as tools an AI assistant calls over the Model Context Protocol, instead of reaching for PromQL, LogQL and TraceQL.
It's 2am. The checkout service is slow. You have everything you need — metrics in Prometheus, logs in Loki, traces in Tempo — but answering "why" means pivoting between three tools and writing PromQL, then LogQL, then TraceQL from memory, half-awake. The data is there. The friction is the query languages and the context-switching.
So I wired the observability stack up as a set of tools an AI assistant can call over the Model Context Protocol (MCP), and analysing an incident became a plain-language conversation. The on-call engineer asks "why was checkout slow around 14:00?" — in human language, not query languages — and the model does the querying and correlation across metrics, logs and traces.
What MCP gives you
MCP is an open protocol that lets an AI assistant call tools and read data you expose. You write an MCP server that publishes a set of typed tools; an MCP client — Claude Desktop, Claude Code, an IDE or your own agent — connects to it, and the model decides when to call each tool and how to chain them.
The important shift: you don't build a chatbot with hard-coded queries. You expose capabilities, and the model orchestrates them. Add a query_tempo tool today and every MCP client can use it tomorrow, without changing the client.
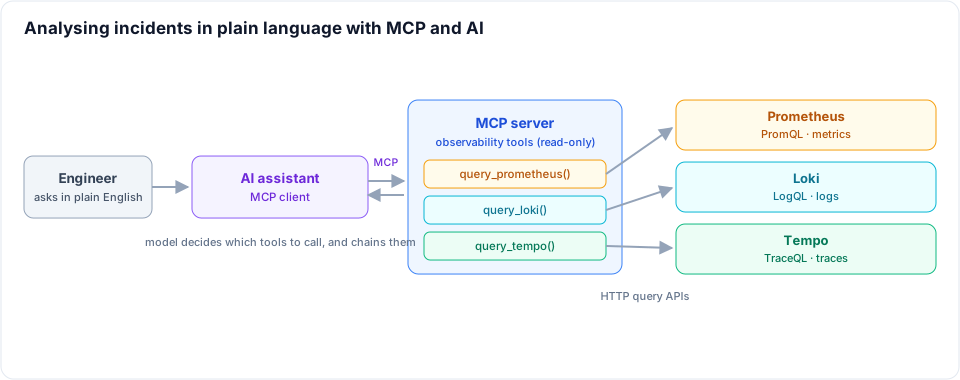
The tools to expose
The server is a thin, read-only adapter over each backend's HTTP API. Three tools cover most investigations:
query_prometheus(promql, start, end, step)— metrics: latency, error rate, saturationquery_loki(logql, start, end, limit)— logs filtered by label and patternquery_tempo(traceql, start, end)andget_trace(trace_id)— traces and spans
With the TypeScript MCP SDK, a tool is a name, a description, a schema and a handler. That description and schema are the interface the model sees, so they need to be clear:
import {McpServer} from '@modelcontextprotocol/sdk/server/mcp.js';
import {z} from 'zod';

const server = new McpServer({name: 'observability', version: '1.0.0'});
const PROM = 'http://prometheus.monitoring.svc.cluster.local:9090';

server.tool(
	'query_prometheus',
	`Run a PromQL range query. Times are RFC3339.
Use for metrics: request latency, error rate, CPU and memory saturation.`,
	{
		promql: z.string(),
		start: z.string(),
		end: z.string(),
		step: z.string().default('30s'),
	},
	async ({promql, start, end, step}) => {
		const url = new URL(`${PROM}/api/v1/query_range`);
		url.search = new URLSearchParams({query: promql, start, end, step}).toString();
		const r = await fetch(url, {signal: AbortSignal.timeout(15_000)});
		if (!r.ok) throw new Error(`Prometheus ${r.status}: ${await r.text()}`);
		const {data} = await r.json();
		return {content: [{type: 'text', text: JSON.stringify(data)}]};
	},
);
query_loki and query_tempo follow the same shape against /loki/api/v1/query_range and Tempo's /api/search — a few dozen lines each. The model writes the PromQL and LogQL; your job is to hand it a safe, well-described door into each system.
What an investigation looks like
Ask: "Why was checkout slow between 14:00 and 14:15 today?" The model strings the tools together on its own:
query_prometheus— p99 latency forcheckoutover that window. It sees a spike at 14:05.query_loki— error-level logs forcheckoutin the same window. It finds a burst of database timeouts.query_tempo— the slowest traces in that window. The bottleneck span is a connection-pool wait on Postgres.- It correlates the three and answers: the latency spike came from Postgres connection-pool exhaustion at 14:05; here are the metric, the log lines and a trace ID.
That is exactly the path an experienced engineer takes — metric anomaly, then logs for the cause, then a trace to confirm — but driven from one plain-language question.
Guardrails — this is the part that matters
Handing an LLM a query interface to production telemetry needs firm boundaries. The discipline lives in the server, not the prompt:
- Read-only by construction. The server only ever calls query endpoints. There is no path to delete a series, change a config or silence an alert.
- Bounded queries. Enforce a maximum time range and step, cap result rows and set hard HTTP timeouts, so a careless query can't melt Prometheus or pull gigabytes of logs.
- Scoped credentials. The server runs with its own least-privilege token. The AI inherits exactly what the server can reach — nothing more.
- Redaction. Logs carry secrets and personal data. Strip or mask sensitive fields before returning them, especially if the client or model is outside your trust boundary.
- Audit everything. Log every tool call with its arguments. You want a record of what was asked and what was returned.
Where it runs
The MCP server is a small service that lives next to your observability stack — a single container in the same cluster, reaching Prometheus, Loki and Tempo over in-cluster DNS. Locally it speaks stdio to a desktop client; in the cluster it serves over HTTP for shared or agent use. Either way it stays inside your network: the telemetry never leaves, only the questions and answers cross the boundary.
The payoff is a change in who can debug. Analysing an incident across three telemetry systems stops being a skill you must carry in your head at 2am and becomes a conversation. The query languages don't go away — the MCP server still speaks them fluently — they just stop being the thing standing between a question and an answer.
Related posts
Incident agents with LangGraph, LangChain and MCP (1/3)
How the investigation itself is built and run — MCP servers as the only door to Prometheus, Loki, Tempo and pod events; a LangGraph state graph running the telemetry sweep and the recall search in parallel; a ReAct loop confined to a single node; an LLM judge deciding whether anything gets posted; why none of it can live inside workflow code; and KEDA scaling the workers to zero between incidents.
How an AI does first-level incident analysis
The first fifteen minutes of every production alert are the same seven steps against the same four systems — and the one step that matters most, "have we seen this before?", is the one a human always loses. How a Slack bot runs that pass in under a minute, and how it and the on-call engineer work the incident together.
Agent memory and context engineering in Postgres (3/3)
An agent whose pod can vanish mid-investigation and whose workflow exits after thirty minutes idle — so every message it has ever seen is a row, in one table with a raw column and a compacted one, with tool output reduced before it reaches the context. Plus one incident thread walked row by row, from 42,709 tokens of telemetry down to 1,889.