Beyond 200 OK: connecting LLM traces to business outcomes with OpenTelemetry
The application-level semantic layer of LLM observability: representing user intent, answer quality and business outcomes as telemetry on the trace, and correlating spans with eval results and feedback to see whether the AI served the user.
LLM observability operates at two levels. The operational level describes how a request ran — tokens, latency, cost, errors — and is instrumented with OpenTelemetry's gen_ai.* conventions, which I cover in observability for AI applications. The application-level semantic layer sits on top and describes what the request meant and whether it served the user: its intent, the quality of the answer and the outcome it led to.
This post explains that semantic layer — how to represent user intent, answer quality and business outcomes as telemetry attached to the trace, so an LLM application can be understood in terms of what users were trying to do rather than only whether the service responded.
Why a successful response isn't a correct one
For a conventional service, a 200 OK is a reliable proxy for success: correct behaviour and a successful response are tightly coupled, so availability and latency cover most of what you need to know.
LLM applications break that coupling. A model call can return 200 OK in 1.8 seconds using 312 tokens and still produce an answer that is confidently wrong. The response was delivered successfully; it simply wasn't right. Operational metrics can't tell the difference — to a latency or error dashboard, a perfect answer and a hallucination look identical.
Application-level semantic observability addresses this by enriching the trace with two things operational metrics never carry: what the user was trying to do, and what happened as a result.
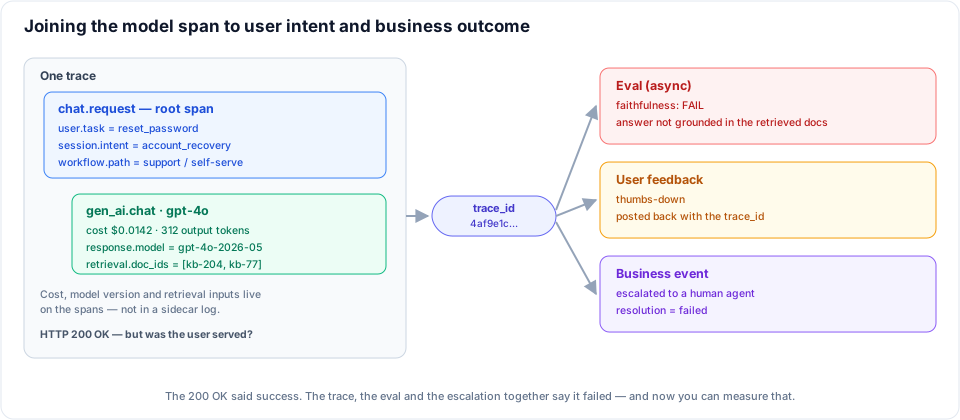
A defining property of this layer is that the trace is correlated with eval results and user-feedback events: a span is understood not only by whether it responded, but by whether the answer was right and whether the user accepted it. The sections below build that picture up piece by piece.
The semantic signals, and how they're monitored
Operational telemetry — the metrics, logs and traces your stack already emits — describes the mechanics of a request. The semantic layer adds a second set of signals describing its meaning and outcome: whether it understood the user's intent, whether the answer was grounded in the source material (faithfulness), whether it was relevant, whether it was safe, whether the user accepted it and whether the task resolved.
These are the semantic signals, and one practical distinction defines them: the operational signals are emitted by your stack automatically, while the semantic ones are produced — through evals, feedback capture and outcome joins — and then attached to the trace.
Monitoring them follows three steps: instrument the trace, produce the semantic signals from evals, feedback and business events, then correlate everything by trace ID and alert on semantic SLOs.
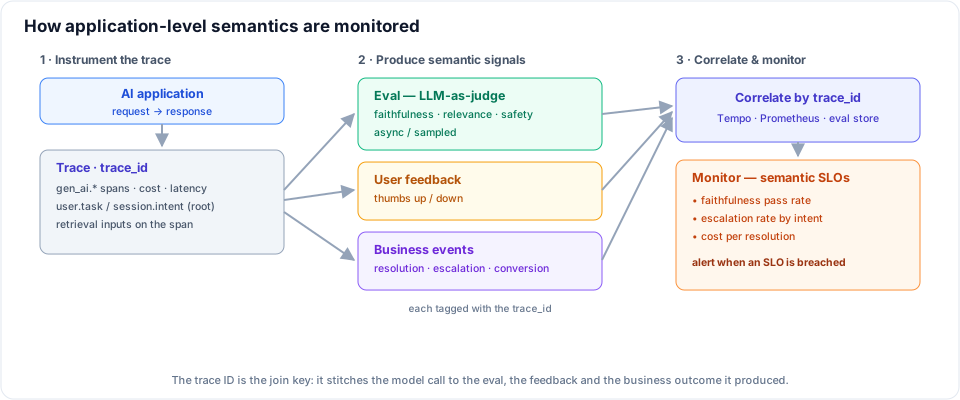
The trace ID is the join key throughout: it stitches the model call to the eval, the feedback and the business outcome it produced. The rest of this post walks through each step — intent on the span, attributes on the model call, and correlation with evals, feedback and business events.
Trace attributes as first-class citizens
The first move is to stop treating the interesting data as logging exhaust. Cost, prompt shape, model version and retrieval inputs belong on the span as attributes, not buried in a sidecar log you have to grep and manually line up by timestamp.
The difference is queryability. If the model version is a span attribute, "p95 latency by model version" or "cost since we shipped the new prompt" is one query. If it's in a log line, it's an afternoon of correlation. Put it on the span:
await tracer.startActiveSpan('gen_ai.chat', async (span) => {
	span.setAttribute('gen_ai.request.model', 'gpt-4o');
	span.setAttribute('gen_ai.response.model', 'gpt-4o-2026-05'); // exact version served
	span.setAttribute('gen_ai.usage.input_tokens', usage.input);
	span.setAttribute('gen_ai.usage.output_tokens', usage.output);
	span.setAttribute('gen_ai.usage.cost_usd', cost(usage)); // derived: tokens x price
	// retrieval inputs that produced this answer — so a bad answer is traceable
	span.setAttribute('rag.retrieval.doc_ids', retrievedIds);
	span.setAttribute('rag.retrieval.top_score', topScore);
	span.end();
});
Recording the retrieval inputs matters more than it looks. When an answer is wrong, the first question is always "did the model hallucinate, or did it get fed the wrong context?" With the retrieved document IDs on the span you can answer it immediately, instead of trying to reconstruct what the retriever returned at the time.
Anchoring to user intent
Attributes about the model tell you how the call ran. They still don't tell you why the user was there. That context lives at the top of the request, so put it on the root span: what the user was trying to accomplish.
await tracer.startActiveSpan('chat.request', async (root) => {
	root.setAttribute('user.task', 'reset_password');
	root.setAttribute('session.intent', 'account_recovery');
	root.setAttribute('workflow.path', 'support/self-serve');
	// ... the rest of the request runs inside this span
	root.end();
});
If the intent needs to be visible on child spans too — to slice the model call or the retrieval by it — propagate it with baggage, which rides alongside the trace context:
import {context, propagation} from '@opentelemetry/api';

const ctx = propagation.setBaggage(
	context.active(),
	propagation.createBaggage({'session.intent': {value: 'account_recovery'}}),
);
// a span processor can copy baggage onto every span in the trace
context.with(ctx, () => handleRequest(req));
This is the unlock. Now you can ask questions that are about users, not infrastructure: which user tasks have the worst answer quality, whether account_recovery costs more per resolution than billing, whether one workflow.path quietly burns twice the tokens of another. The same telemetry, sliced by what people were actually trying to do.
Closing the loop
Intent on the way in is half of it. The other half is the outcome — and the outcome usually arrives later, from a different system. The join key that makes this possible is the trace ID. Capture it at request time, return it to the client, and stamp it on everything downstream:
import {trace} from '@opentelemetry/api';

const spanCtx = trace.getActiveSpan()?.spanContext();
const traceId = spanCtx?.traceId; // already 32-char hex — return this with the response
With that ID flowing outward, you can correlate the trace with the three signals that actually define whether the AI worked:
- Eval failures. An offline or async judge scores the answer — faithfulness, relevance, refusal — and writes the verdict keyed by trace ID. Now "show me the traces that failed faithfulness" is a real query.
- Explicit feedback. When the user clicks thumbs-down, the client posts that feedback back with the trace ID it was given. The complaint is now attached to the exact prompt, context and model version that produced it.
- Business events. Did the conversation convert? Was the support case resolved or escalated? Did the user abandon? Emit these with the trace ID (or join them in the warehouse), and you can finally measure the thing that matters: of the answers that failed an eval, how many led to an escalation?
That last query is the whole point. It connects a model span to revenue and resolution — the difference between "the service was up" and "the AI did its job."
How the LLM-as-judge produces the eval scores
The faithfulness numbers used below — 71% for technical_support, 96% for order_status — come from an LLM-as-judge: a second model call that grades each answer against an explicit rubric. For faithfulness the rubric is groundedness — is every factual claim in the answer supported by the retrieved context? The judge is given the question, the retrieved context (the same rag.retrieval.doc_ids recorded on the span) and the answer, and returns a structured verdict.
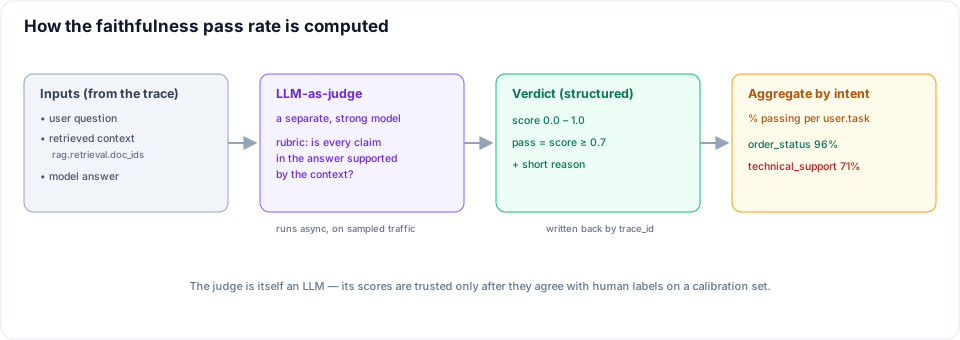
The judge runs off the hot path on sampled traffic, and the prompt asks for a numeric score and a short reason so each verdict is auditable:
const JUDGE_RUBRIC = `You are grading an answer for faithfulness.
Given the CONTEXT and the ANSWER, decide whether every factual claim in the
ANSWER is supported by the CONTEXT. Unsupported or invented claims fail.
Return JSON: {"score": 0.0-1.0, "supported_claims": int, "total_claims": int, "reason": "..."}`;

const resp = await judge.chat.completions.create({
	model: 'gpt-4o', // strong model, ideally not the one being judged
	response_format: {type: 'json_object'},
	messages: [
		{role: 'system', content: JUDGE_RUBRIC},
		{role: 'user', content: `CONTEXT:\n${retrieved}\n\nANSWER:\n${answer}`},
	],
});
const verdict = JSON.parse(resp.choices[0].message.content ?? '{}');
const passed = verdict.score >= 0.7; // the pass/fail threshold
Each verdict is written back against the trace ID, and the faithfulness pass rate is simply the share of sampled answers that clear the 0.7 threshold, aggregated by user.task — which is exactly the per-intent column on the dashboard.
Two things make those scores an instrument rather than another model's opinion:
- A narrow, explicit rubric. "Is every claim supported by the context?", with a claim count, is far more reliable than "is this a good answer?". Decomposing the answer into claims and, where you have them, comparing against a golden reference, scores far more consistently than a single holistic grade.
- Calibration against humans. The judge is itself an LLM, so before its scores drive decisions you validate them on a human-labelled set and measure agreement. A judge that matches human graders ~90% of the time is a usable instrument; one that doesn't is noise. You re-check that agreement whenever the judge model or rubric changes.
This is why faithfulness — a calibrated judge that scores every sampled conversation — carries the dashboard rather than thumbs-up, which is sparse and self-selecting.
Where the eval actually runs
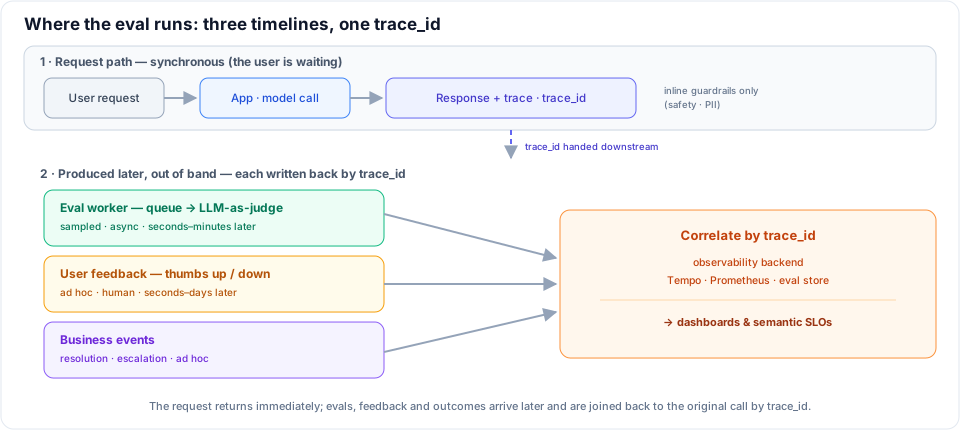
A natural question at this point: the trace belongs to the LLM request, so are we evaluating inside that request? No — and that separation is the whole architecture. Three things happen on three different timelines, joined by one trace_id.
-
The request path (synchronous). The user's call runs the model, returns the response and emits the trace —
trace_id, prompt, retrieved context and answer on the spans. The user is waiting, so the only thing that runs here is a cheap, must-block guardrail (safety, PII). The judge does not run here: it would add a second model call's latency and cost to every request, for a verdict the user never sees. -
The eval path (asynchronous, sampled). A separate worker runs the LLM-as-judge off the hot path — either consuming an eval queue the app publishes to at response time (
{trace_id, question, context, answer}), or tailing the traces exported by the collector. It scores a sample of traffic, not all of it, and writes each verdict back keyed bytrace_id, seconds to minutes later. -
The feedback path (ad hoc, human). This is a separate source, not an eval. When the user clicks thumbs up or down, the client posts it with the
trace_idit was handed at response time. It arrives whenever — seconds to days later. Business events such as resolution and escalation arrive the same way.
So evals and feedback are two different signal sources on two different clocks, and neither runs inside the request. The trace_id, captured at request time and carried outward, is the stable key that lets a verdict produced minutes later and a thumbs-down produced days later both join back to the exact model call that caused them. That leaves one open decision — what little must run inline versus what can wait off the hot path.
Inline vs async quality checks
That decision comes down to a real tension: checking quality costs time, and the user is waiting. The resolution is to split checks by their purpose.
Inline — on the hot path, adding latency to the response. Reserve this for checks that are cheap and must block a bad response from reaching the user: a safety or policy filter, PII leakage, an obvious refusal or empty answer. These are guardrails, and a few hundred milliseconds is worth paying to stop a harmful answer.
Async — off the hot path, after the response has gone out. This is where the expensive quality work belongs: LLM-as-judge faithfulness scoring, relevance grading, semantic similarity to a golden answer. Running an LLM judge inline would often double your latency for a verdict the user never sees — so don't. Sample the traffic, score it in a consumer that reads the traces, and write the result back against the trace ID.
A practical pattern: tag each check with where it ran, so the latency budget is visible too.
// inline guardrail — blocks, so keep it cheap
tracer.startActiveSpan('guardrail.safety', (g) => {
	g.setAttribute('check.kind', 'inline');
	g.setAttribute('check.passed', safe);
	g.end();
});

// async eval — emitted later, linked back to the original trace
tracer.startActiveSpan(
	'eval.faithfulness',
	{links: [{context: originalSpanContext}]},
	(e) => {
		e.setAttribute('check.kind', 'async');
		e.setAttribute('eval.score', score);
		e.setAttribute('eval.passed', score >= 0.7);
		e.end();
	},
);
The span link is the clean way to attach an async verdict to the request it judges without forcing it into the original trace's timing.
What the data actually shows
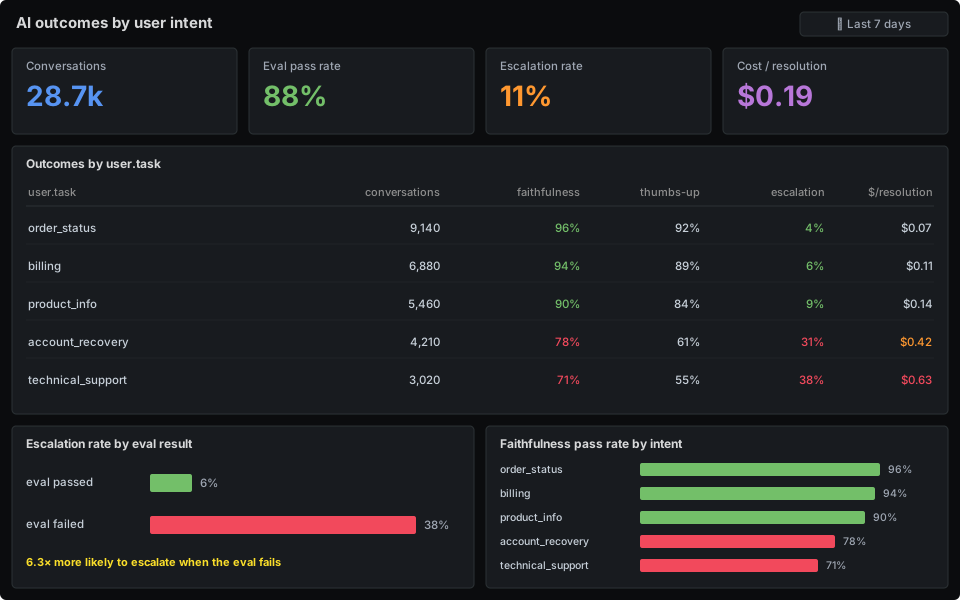
Once intent is on the root span and outcomes are joined by trace ID, the dashboard stops being about infrastructure and starts being about the product. Here's the shape of it for a support assistant over a week — the same telemetry, sliced by user.task and joined to evals, feedback and resolution:
Three findings jump out, and none of them are visible in a latency or token chart:
- Quality is wildly uneven by intent.
order_statusandbillinganswer faithfully 94–96% of the time and escalate 4–6%.account_recoveryandtechnical_supportsit at 71–78% faithfulness and escalate 31–38%. Aggregate "88% pass rate" hid two intents that are quietly failing a third of their users. You only see this once you slice by what the user was trying to do. - Eval failure predicts escalation. Answers that failed the faithfulness eval escalated 38% of the time, versus 6% when they passed — 6.3× higher. That correlation is the proof that the eval is measuring something real, and it's the bridge from a model span to a business cost. Tokens and latency can't draw that line.
- Cost per resolution tells a different story than cost per call.
technical_supportcosts $0.63 per resolved conversation — 9×order_status— not because each call is dear, but because failed answers get retried and escalated. Cost per call looked fine; cost per outcome exposed the waste.
The same data drawn as a funnel shows where users actually fall out — and how little of it availability monitoring can even see:
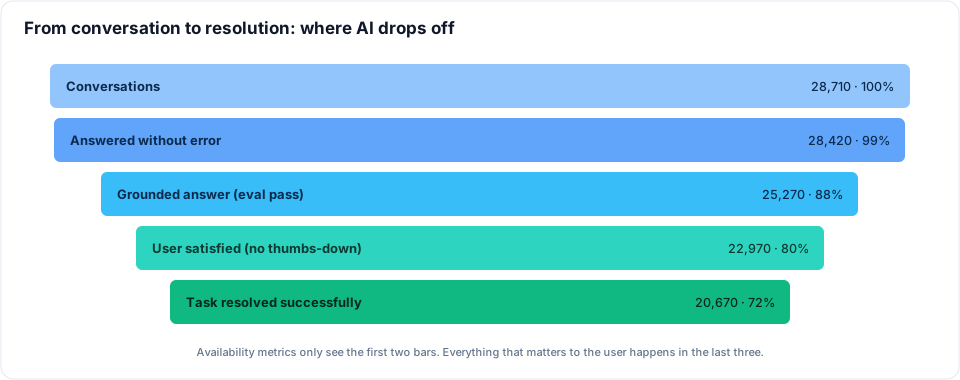
The first two bars — conversations received and answered without an error — are the only ones a 200 OK or an uptime SLO can see, and they sit at 99–100%. The drops that matter to the user happen after the response was successfully delivered: here, a quarter of conversations never reach a resolved outcome, which only the semantic layer surfaces.
Using the signals to improve output quality
The semantic layer is most useful because it closes a loop — observe, diagnose, act, measure — that operational metrics can't drive on their own. Here is that loop applied to technical_support, the worst intent in the table above:
- Observe. The dashboard flags
technical_supportat 71% faithfulness and 38% escalation — far below the rest. The aggregate looked fine; the per-intent slice made the problem unmissable. - Diagnose. Drill into the failing traces. The
rag.retrieval.doc_idson the spans show the retriever was returning generic FAQ pages, not the device-specific articles — and the model was dutifully answering from the wrong context. The failure was retrieval, not the model. You can only know that because the retrieval inputs are on the span. - Act. Three targeted changes, each tied to that diagnosis and shipped separately so its effect is visible:
- a reranker plus fixed chunking, because retrieval was the diagnosed cause
- prompt v2, instructing the model to answer only from the supplied context and cite the source, to cut confidently-ungrounded answers
- routing the hardest queries to a stronger model, to mop up the long tail
- Measure. Watch the same semantic signal move after each deploy.
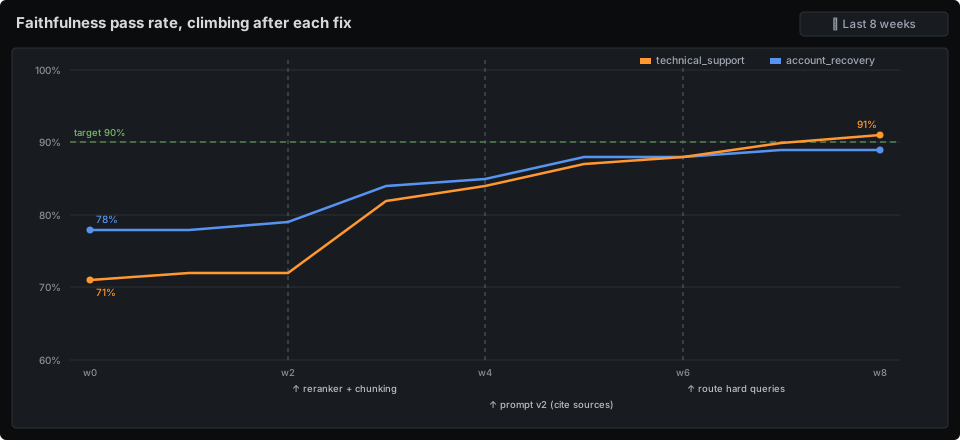
The results over the eight weeks:
technical_supportfaithfulness: 71% → 91%, and its escalation rate fell from 38% to 14%.account_recovery: 78% → 89% on the same changes.- The reranker gave the biggest single jump (+10 points), confirming the retrieval diagnosis; the prompt change cut the confidently-wrong answers; the model route handled the remainder.
The point isn't the numbers — it's that each change was attributable. Because faithfulness was measured for technical_support specifically and tied to a deploy, you know which fix worked and which didn't. Without trace-level semantic signals you'd have shipped three changes against a blended aggregate, watched it barely move, and had no idea which one to keep. That attribution is the entire return on building the semantic layer.
In summary
Application-level semantic observability is built from a handful of concrete pieces, all anchored to the trace:
- Intent on the root span —
user.task,session.intent,workflow.path— so telemetry can be sliced by what the user was doing. - Attributes on the model span — cost, model version and retrieval inputs — so each answer is queryable and its context reconstructable.
- The trace ID carried outward — to evals, user feedback and business events — so quality and outcome become signals you can join, not anecdotes.
- Inline guardrails and async evals — split by their latency cost — feeding verdicts back to the trace.
Together these form the semantic layer that sits on top of the operational gen_ai.* instrumentation: operational telemetry describes whether the service responded, and the semantic layer describes whether it served the user.
Related posts
How an AI does first-level incident analysis
The first fifteen minutes of every production alert are the same seven steps against the same four systems — and the one step that matters most, "have we seen this before?", is the one a human always loses. How a Slack bot runs that pass in under a minute, and how it and the on-call engineer work the incident together.
Observability for AI applications with OpenTelemetry
LLM apps fail in ways ordinary services don't — silent quality drops, runaway token costs, latency you can't explain. Here's how to instrument them with OpenTelemetry's GenAI conventions and see tokens, cost, latency and traces in Grafana.
Agent memory and context engineering in Postgres (3/3)
An agent whose pod can vanish mid-investigation and whose workflow exits after thirty minutes idle — so every message it has ever seen is a row, in one table with a raw column and a compacted one, with tool output reduced before it reaches the context. Plus one incident thread walked row by row, from 42,709 tokens of telemetry down to 1,889.