Observability for AI applications with OpenTelemetry
LLM apps fail in ways ordinary services don't — silent quality drops, runaway token costs, latency you can't explain. Here's how to instrument them with OpenTelemetry's GenAI conventions and see tokens, cost, latency and traces in Grafana.
A traditional service is easy to reason about: same input, same output, and latency you can mostly predict. An LLM application is none of those things. The same prompt costs a different number of tokens each time, latency is dominated by a model you don't control, spend can quietly triple overnight, and the response can be wrong while every HTTP status code says 200. Standard APM tells you the request succeeded — it can't tell you it cost forty cents and returned nonsense.
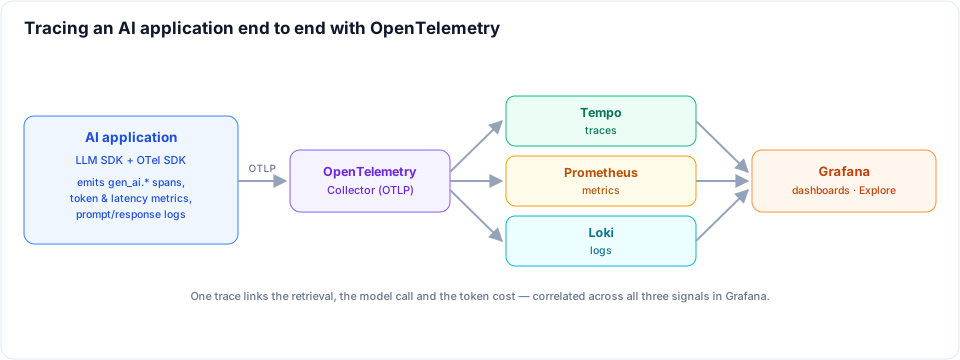
So AI applications need observability built around what actually varies: tokens, cost, model latency and the shape of each request. The good news is you don't need a bespoke stack. OpenTelemetry now has semantic conventions for generative AI, and the same Grafana, Tempo, Prometheus and Loki setup I covered in the APM post handles it.
What's different about instrumenting an LLM
Three things matter for an AI app that don't for a normal one:
- Tokens are the unit of cost and the unit of work. Input and output token counts drive both your bill and your latency, so they belong on every model call.
- Latency has a new dimension. For streaming responses, time to first token (TTFT) is what users feel, not total duration. A 5-second answer that starts streaming in 300ms feels fast; one that hangs for 4 seconds doesn't.
- A request is a pipeline, not a call. A single RAG question fans out into retrieval, reranking and one or more model calls. You want one trace that ties them together, so you can see which step actually cost the time.
The GenAI semantic conventions
OpenTelemetry defines a standard set of gen_ai.* attributes, so a model call looks the same whether it's OpenAI, Anthropic, Bedrock or a self-hosted model. Standardising on them means your dashboards and queries work across providers. The ones worth capturing on every call:
gen_ai.system— the provider (openai,anthropic,aws.bedrock)gen_ai.request.modelandgen_ai.response.modelgen_ai.operation.name—chat,embeddings,text_completiongen_ai.usage.input_tokensandgen_ai.usage.output_tokensgen_ai.request.temperature,gen_ai.request.max_tokensgen_ai.response.finish_reasons—stop,length,content_filter
Instrumenting the application
You rarely write these spans by hand. Libraries like OpenLLMetry or OpenInference auto-instrument the common SDKs and emit the gen_ai.* conventions for you — initialise once and every model call is traced:
import * as traceloop from '@traceloop/node-server-sdk';
import OpenAI from 'openai';

// exports OTLP to your collector; auto-instruments the OpenAI/Anthropic SDKs
traceloop.initialize({appName: 'support-assistant', instrumentModules: {openAI: OpenAI}});

const client = new OpenAI();
const resp = await client.chat.completions.create({
	model: 'gpt-4o',
	temperature: 0.2,
	messages: [{role: 'user', content: question}],
});
When you orchestrate a pipeline yourself, wrap each stage in a span so the trace shows the whole request. The model call slots in as a child span with the GenAI attributes:
import {trace} from '@opentelemetry/api';

const tracer = trace.getTracer('rag');

const answer = await tracer.startActiveSpan('chat.request', async (root) => {
	const chunks = await tracer.startActiveSpan('rag.retrieve', async (s) => {
		const hits = await vectorStore.search(question, {k: 8});
		s.end();
		return hits;
	});
	const context = await tracer.startActiveSpan('rag.rerank', async (s) => {
		const ranked = (await rerank(question, chunks)).slice(0, 4);
		s.end();
		return ranked;
	});
	// the LLM call here is auto-instrumented as gen_ai.chat
	const result = await answerWithContext(question, context);
	root.end();
	return result;
});
Collect it the standard way
Point the SDK at an OpenTelemetry Collector over OTLP and let the collector route each signal to its backend — traces to Tempo, metrics to Prometheus, logs to Loki. Nothing here is AI-specific; that's the point. The collector also lets you derive cost centrally: a span processor can read the token counts and the model, multiply by your price table and attach gen_ai.usage.cost, so cost lives next to every span without touching application code.
The traces: see where the time and tokens go
This is where AI observability earns its keep. A trace turns a vague "the assistant is slow" into a precise answer. Open one request in Grafana's Tempo view and the breakdown is obvious — retrieval and reranking are tens of milliseconds, and the model call is everything else:
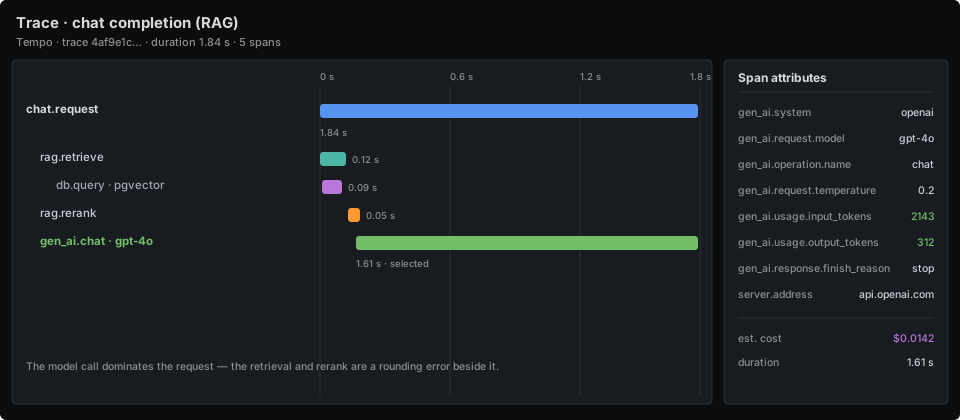
Because the token counts ride on the span as gen_ai.* attributes, every trace also tells you what that specific request cost. When spend spikes, you don't guess — you sort traces by token count and find the prompt that ballooned.
The dashboards: tokens, cost and latency at a glance
With the metrics in Prometheus, a Grafana dashboard gives you the health of the whole AI surface — request rate, p95 latency, token throughput, estimated spend, and the model-by-model breakdown that tells you where the cost and the slowness actually live:
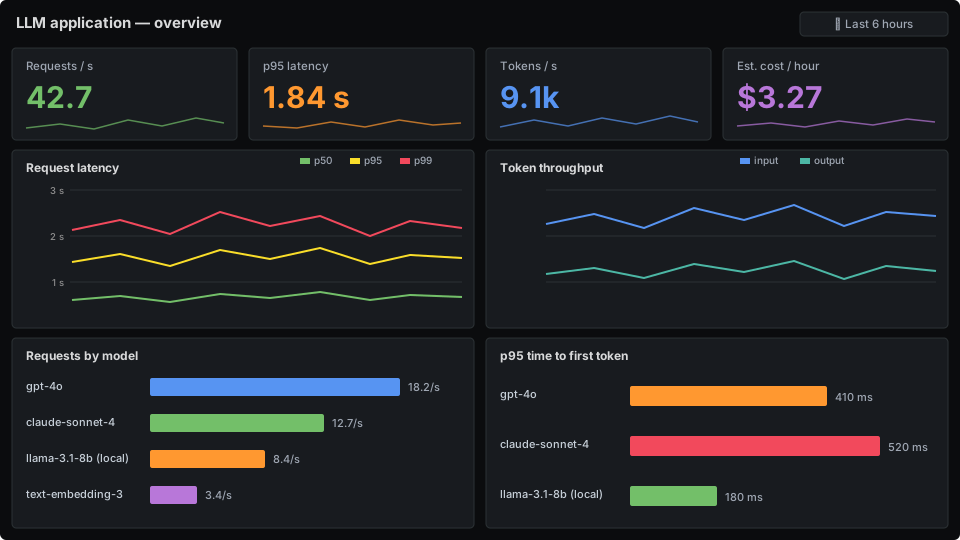
The panels that have repeatedly earned their place:
- Cost per hour and cost per request, broken down by model — the single best early warning for a runaway prompt or a model swap gone wrong.
- Token throughput, input versus output — output tokens are usually the expensive half, and a creeping output length is a cost leak.
- TTFT and total latency percentiles by model — so you can tell a provider slowdown apart from your own pipeline regressing.
- Error and refusal rate —
finish_reasonsofcontent_filterorlengthare failures users feel even though the HTTP call succeeded.
Capturing prompts and responses — carefully
Logging the actual prompt and completion is invaluable for debugging a bad answer, but it's also the riskiest part. Prompts carry user data, and completions can echo it back. Treat prompt/response capture as opt-in, sample it rather than logging everything, and redact PII before it leaves the process. Keep the full text in Loki with a short retention, and link it to the trace by trace ID so you can pull the exact prompt behind a slow or wrong response without storing every conversation forever.
Tying it together
The model is a black box you can't see inside, but everything around it is yours to measure. Instrument the calls with OpenTelemetry's gen_ai.* conventions, derive cost from the token counts, and the same Grafana stack that watches your services will watch your AI — traces that show where each request spends its time and money, dashboards that catch a cost or quality regression before the bill does. For the inference side of this, see deploying AI inference on Kubernetes; for the retrieval half of a RAG trace, building a RAG pipeline.
Related posts
Beyond 200 OK: connecting LLM traces to business outcomes with OpenTelemetry
The application-level semantic layer of LLM observability: representing user intent, answer quality and business outcomes as telemetry on the trace, and correlating spans with eval results and feedback to see whether the AI served the user.
Application performance monitoring with OpenTelemetry, Grafana and Tempo
How to set up application performance monitoring using OpenTelemetry for instrumentation, Tempo for traces and Grafana for unified visibility.
How an AI does first-level incident analysis
The first fifteen minutes of every production alert are the same seven steps against the same four systems — and the one step that matters most, "have we seen this before?", is the one a human always loses. How a Slack bot runs that pass in under a minute, and how it and the on-call engineer work the incident together.