Application performance monitoring with OpenTelemetry, Grafana and Tempo
How to set up application performance monitoring using OpenTelemetry for instrumentation, Tempo for traces and Grafana for unified visibility.
Most APM tools are expensive, lock you into a vendor and make it hard to own your data. The OpenTelemetry + Grafana stack gives you the same visibility at a fraction of the cost — and since it's all open standards, switching storage backends later is straightforward.
This is the observability stack I've deployed across multiple customer environments.
The components
- OpenTelemetry SDK — instruments your application and emits traces, metrics and logs
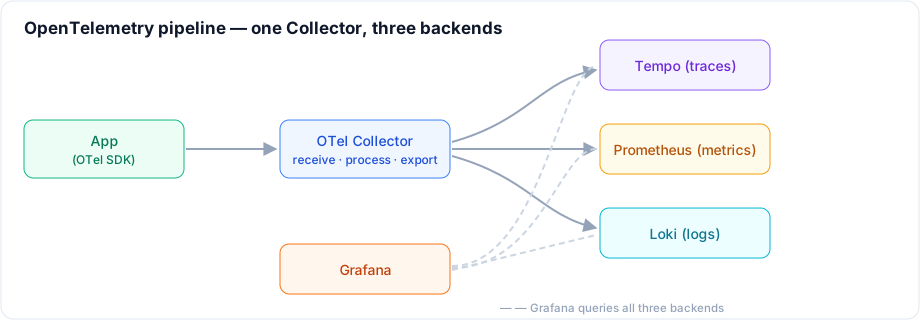
- OpenTelemetry Collector — receives, processes and exports telemetry to backends
- Tempo — Grafana's distributed tracing backend (stores and queries traces)
- Grafana — unified UI for traces, metrics (Prometheus) and logs (Loki)
Instrumenting your application
For a Node.js service, auto-instrumentation covers most of the common libraries (HTTP, Express, database drivers) without changing application code:
npm install @opentelemetry/sdk-node \
            @opentelemetry/auto-instrumentations-node \
            @opentelemetry/exporter-trace-otlp-grpc \
            @opentelemetry/resources \
            @opentelemetry/semantic-conventions
Create an instrumentation.ts that runs before your app:
import {NodeSDK} from '@opentelemetry/sdk-node';
import {getNodeAutoInstrumentations} from '@opentelemetry/auto-instrumentations-node';
import {OTLPTraceExporter} from '@opentelemetry/exporter-trace-otlp-grpc';
import {resourceFromAttributes} from '@opentelemetry/resources';
import {ATTR_SERVICE_NAME} from '@opentelemetry/semantic-conventions';

const sdk = new NodeSDK({
	resource: resourceFromAttributes({
		[ATTR_SERVICE_NAME]: process.env.SERVICE_NAME ?? 'my-service',
	}),
	traceExporter: new OTLPTraceExporter({
		url: process.env.OTEL_EXPORTER_OTLP_ENDPOINT ?? 'http://otel-collector:4317',
	}),
	instrumentations: [getNodeAutoInstrumentations()],
});

sdk.start();
Start it with node -r ./instrumentation.js server.js.
Deploying the Collector
The Collector is the central hub — it decouples your apps from the backends so you can change storage without touching service code.
apiVersion: v1
kind: ConfigMap
metadata:
  name: otel-collector-config
  namespace: monitoring
data:
  config.yaml: |
    receivers:
      otlp:
        protocols:
          grpc:
            endpoint: 0.0.0.0:4317
          http:
            endpoint: 0.0.0.0:4318

    processors:
      batch:
        timeout: 5s
        send_batch_size: 1024
      memory_limiter:
        limit_mib: 512

    exporters:
      otlp:
        endpoint: tempo.monitoring.svc.cluster.local:4317
        tls:
          insecure: true
      prometheus:
        endpoint: 0.0.0.0:8889
      loki:
        endpoint: http://loki.monitoring.svc.cluster.local:3100/loki/api/v1/push

    service:
      pipelines:
        traces:
          receivers: [otlp]
          processors: [memory_limiter, batch]
          exporters: [otlp]
        metrics:
          receivers: [otlp]
          processors: [batch]
          exporters: [prometheus]
        logs:
          receivers: [otlp]
          processors: [batch]
          exporters: [loki]
Tempo for traces
Tempo stores traces as objects on disk (or object storage like S3/GCS). It's queried via TraceQL from Grafana.
Deploy the single-binary chart via Helm, enabling the OTLP gRPC receiver so the Collector can push to it:
helm repo add grafana https://grafana.github.io/helm-charts
helm install tempo grafana/tempo \
  -n monitoring \
  --set 'traces.otlp.grpc.enabled=true'
This exposes a tempo service with OTLP ingest on 4317 and the query API on 3100 — matching the Collector exporter endpoint above. For production, point storage.trace.backend at S3 or GCS; local disk doesn't survive pod restarts.
Connecting Grafana
Add Tempo as a data source in Grafana:
- Type: Tempo
- URL:
http://tempo.monitoring.svc.cluster.local:3100 - Enable Trace to logs and link your Loki data source — Grafana will correlate a trace's time range with the logs from the same service automatically.
Now in Grafana → Explore, you can:
- Search traces by service, duration and status (
{ .http.status_code = 500 }) - Click a span to see the full trace waterfall
- Jump directly from a slow span to the corresponding log lines
What you get
Once all three services are instrumented, a single slow API request gives you:
- Trace waterfall — which service took how long, which DB query was the bottleneck
- Correlated logs — the exact log lines from each service during that request
- Service graph — which services call which, and their error rates and p99 latencies
The service graph in Grafana is built automatically from trace data — no configuration required. It's usually the first thing I show teams to make them realise what they've been missing without distributed tracing.
One thing to get right early
Set OTEL_RESOURCE_ATTRIBUTES=service.name=<name>,service.namespace=<team> as environment variables on every deployment. Trace data without good service names is nearly unusable. Do this from the start — retrofitting it across 20 services is painful.
Related posts
Observability for AI applications with OpenTelemetry
LLM apps fail in ways ordinary services don't — silent quality drops, runaway token costs, latency you can't explain. Here's how to instrument them with OpenTelemetry's GenAI conventions and see tokens, cost, latency and traces in Grafana.
How an AI does first-level incident analysis
The first fifteen minutes of every production alert are the same seven steps against the same four systems — and the one step that matters most, "have we seen this before?", is the one a human always loses. How a Slack bot runs that pass in under a minute, and how it and the on-call engineer work the incident together.
Beyond 200 OK: connecting LLM traces to business outcomes with OpenTelemetry
The application-level semantic layer of LLM observability: representing user intent, answer quality and business outcomes as telemetry on the trace, and correlating spans with eval results and feedback to see whether the AI served the user.